Broad Branch is a tributary of Rock Creek in Washington DC, and
Linnean Creek is a tributary of Broad Branch. The
Broad Branch stream restoration project was needed because a portion
of the stream was put in a pipe and because uncontrolled stormwater
had caused erosion that created unstable gullies and led to
sedimentation in the mainstem of Broad Branch. This destabilized the
surrounding environment, reduced infiltration of water into
underlying aquifers, and compromised wildlife habitat. When this
portion of Broad Branch was piped the stormwater flowing to it was
untreated and without intervention the hot, fast stormwater flows
would have continued to degrade and pollute the stream.
The restoration project took a portion of Broad Branch that was
piped underground in 1937 and restored it to its historic channel, a
process known as “daylighting.” This will help process and remove
pollutants from the stream by exposing it to sunlight, air, soil,
and vegetation. It will also reduce nutrient and sediment pollution
from erosion caused by fast-flowing stormwater and non-point source
pollution by increasing groundwater infiltration and creating
meanders and floodplain wetlands. As
a part of the project additional surface flow from adjacent streets
and rooftops was directed to the area by creating curb cuts and
redirecting storm sewers to rain gardens further slowing, cooling,
and filtering stormwater in the subwatershed.
The method chosen for this restoration
work is called regenerative
stream channel (RSC), also known as a coastal plain outfall. It is
a specialized stream restoration technique that utilizes sand, wood
chips, stone and logs to create a system of physical features,
chemical processes, and biological mechanisms that greatly reduce
erosive forces and positively impact the ecology of a drainage
area.
There are four governmental agencies
involved in this project, the Department of the Environment (DDOE),
the Department of Transportation (DDOT), the District of Columbia
Water and Sewer Authority (DC WASA), and the National Park Service
(NPS). The restored Broad Branch will be a beautiful addition to
the National Park Service’s Rock Creek Park in Northwest.
If you used the other activities in the
Benthic Macroinvertebrate Portal prior to using this activity, you
should have a good understanding of everything you did in A
Virtual Stream Sampler. If you haven't used those
activities, we suggest you run through the Introduction to
Stream Sampling to get the basics.
Click here to see a
summary of the BMIs you picked in the Broad Branch/Linnean Creek Virtual Stream.
 |
 |
|
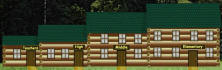
This section of
Broad Branch begins as a small spring (left) that has been
piped underground from this point on since 1937. Soon,
the water from this spring will again flow above ground
through this culvert (right). |
 |
 |
|
Restoration using
the regenerative stormwater conveyance (RSC)
technique creates a series of step pools that utilize a
variety of massive and small woody debris to absorb the
power of stormwater runoff and provide surfaces for
biological activity. |
 |
 |
|
Keith Underwood
(left), the designer of this restoration, gives a tour of
the Linnean Creek part of this restoration to Department of
the Environment staff. At right you see the culvert
where Linnean Creek is temporarily forced underground to get
under the road. |
 |
 |
|
It took a number
of weeks for the Linnean Creek restoration to fill with
water, because this restoration approach fills more than the
surface channel with water. It restores an active
floodplain and water has to fill the underground portion of
this watershed first. Hydrating the floodplain in this
way helps keep the stream flowing during dry periods.
|
 |
Your Score
The benthic macroinvertebrate section is worth
50% of the total score, the other two sections are each worth 25% of
final score.
-
In the benthic macroinvertebrate section,
if there are 15 organisms, then finding everything in the net is
worth 15 points, and correctly identifying everything is worth
15 points, for a total of 30 points (100%). You are
penalized heavily if you guess at answers on the list and
get them wrong. Every wrong guess is a point off.
Since you have three chances to guess at the answer for each
organism before you are forced to use the dichotomous key, with
15 organisms that would be 45 points off. Yes, you can get
a very negative score. So, if you don't know what
something is, don't guess - use the key. Guessing in
the key is not penalized.
-
The habitat section has a maximum
score of 5. Each wrong answer counts off one. Each
question you don't try to answer counts off two. So you
are better off guessing and being wrong than not answering at
all. If you don't guess on anything you can get a
negative 100% score in this section. Ouch!
-
The water quality section has a
maximum score of 6. Each wrong answer counts one off.
Each question you don't try to answer counts 2 off. So you
are better off guessing and being wrong than not answering at
all. If you don't guess on anything you can get a
negative 100% score in this section. Ouch!
-
Even though you can get negative
scores in each section, the worst total score you can get is
zero.
The Stream Score
Aquatic
organisms can be used as indicators of water quality. The advantage
of using aquatic organisms over chemical indicators - such as the
amount of a certain chemical in a water sample - is that animals are
constantly "sampling" their environment. The communities of
organisms found in benthic samples are indicative of water quality
conditions over time. Chemical measures, in contrast, provide a
momentary snapshot of conditions in a constantly changing
environment.
Many
years ago, the focus was on "indicator
species." An indicator species is one that, by its presence,
absence, or abundance relative to other organisms, indicates
environmental conditions. For example, the presence of numerous
non-biting midge (Chironomidae) larvae in a stream may indicate
severe organic pollution.
Over the years,
researchers generally moved away from the use of individual
indicator species and toward "metrics" that look at groups of
species. A typical metric might look at the total number of
different species or the relative abundance of different species.
For instance, if a researcher finds that species tolerant of
degraded water quality outnumber kinds that are intolerant of
pollution, it is more likely that degraded conditions exist But the
mere presence of pollution-tolerant organisms does not necessarily
equate to water quality problems, because these organisms are often
widely distributed.
A
Virtual Stream Sampler scores the stream using two popular
methods in use by volunteers in the Chesapeake Bay Watershed, the
West Virginia Save Our Streams Stream Score Index, and Virginia Save
Our Streams Stream Score. Both of these scores are based on a
suite (a group) of "metrics" that, when averaged together, are an
effective way to tell a stream's story. Two metrics are used
by both West Virginia and Virginia:
-
percent tolerant organisms tells you
what percentage of the organism in the sample are tolerant of
pollution, and
-
Virginia's percent
Mayflies, Stoneflies, and most Caddisflies is similar to West
Virginia's % EPT score. This score looks at what
percentage of the sample consist of theswe three groups of
insects that are mostly sensitive to pollution. Virginia's
score breaks out the pollution tolerant "common netspinner
caddisfly."
The two tables below
provide details on each system, and links for more information.
|
Virginia SOS Stream
Score |
|
Metric |
Your Metric Score |
Good (2) |
OK (1) |
Poor (0) |
|
% Mayflies, Stoneflies, and Most Caddisflies |
X% |
> 32.2 |
16.1 to 32.2 |
< 16.1 |
|
% Common Netspinner |
X% |
< 19.7 |
19.7 to 34.5 |
> 34.5 |
|
% Lunged Snail |
X% |
< 0.3 |
0.3 to 1.5 |
> 1.5 |
|
% Beetle |
X% |
> 6.4 |
3.2 to 6.4 |
< 3.2 |
|
% Tolerant Organisms |
X% |
< 46.7 |
46.7 to 61.5 |
> 61.5 |
|
% Non-Insect Organisms |
X% |
< 5.4 |
5.4 to 20.8 |
> 20.8 |
|
Get
details on how the Virginia Save Our Streams Score is calculated and
learn much more about the Virginia
program. |
Total # of 2s: |
Total # of 1s: |
Total # of 0s: |
|
N2 |
N1 |
N0 |
|
Multiply by 2: |
Multiply by 1: |
Multiply by 0: |
|
N2 x 2 = S2 |
N1 x 1 =S1 |
N0 x 0 = S0 |
|
Now add the 3 subtotals (S2 + S1 + S0) to get the Save Our Streams Multimetric Index
Score |
|
_____ Acceptable Conditions (9 to 12)
_____ Conditions cannot be Determined - Gray Area (8)
_____ Unacceptable Conditions (0 to 7)
|